
Program Overview
In today’s data-driven business environment, organizations need effective tools to transform complex information into meaningful insights that support strategic and operational decision-making.
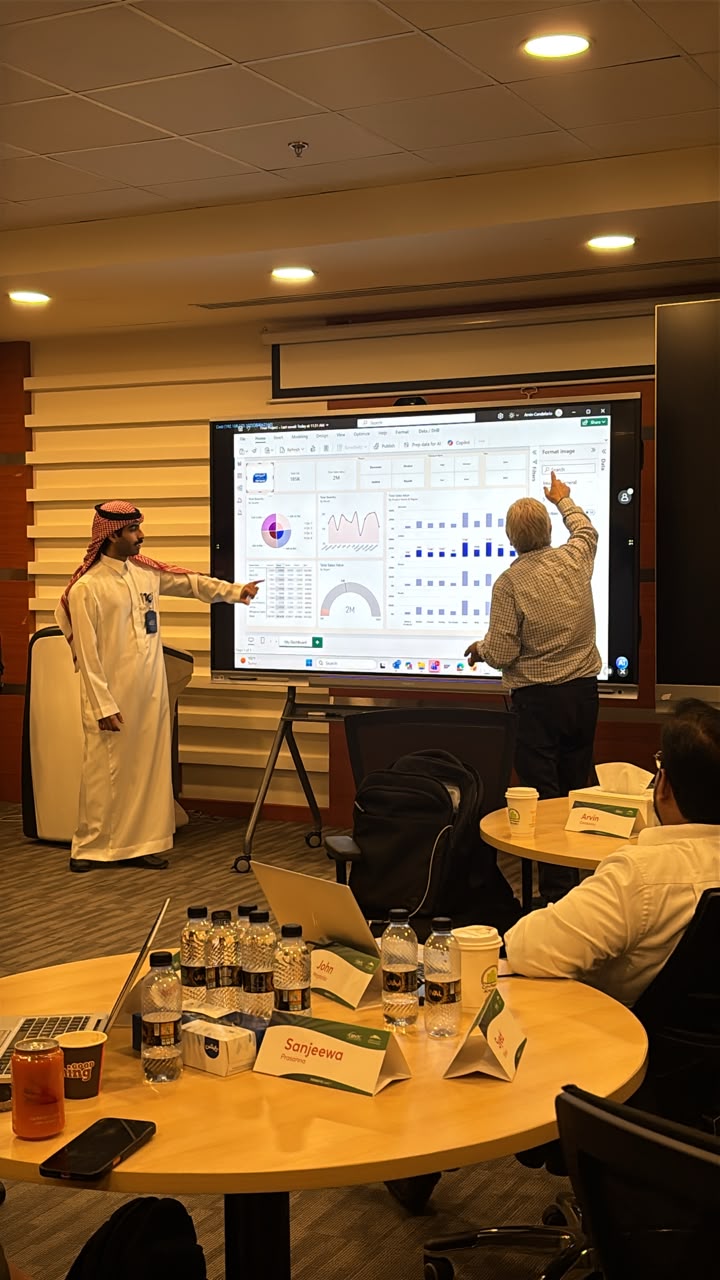
The Power BI: Data Analysis & Business Intelligence program equips participants with practical skills in data preparation, visualization, dashboard development, and business reporting using Microsoft Power BI.
Through hands-on exercises and business-focused examples, participants will learn how to connect data sources, build interactive reports, analyze performance indicators, and communicate insights that support organizational objectives.
Program Objectives
- Understand the fundamentals of business intelligence and data analytics.
- Learn to connect, clean, and transform data using Power BI.
- Develop effective data models and relationships.
- Create interactive dashboards and professional reports.
- Apply data analysis techniques to support business decisions.
Key Learning Outcomes
Upon completing the program, participants will be able to:
- Import and prepare data from different sources.
- Build structured data models using Power BI.
- Create meaningful visualizations and interactive dashboards.
- Use DAX calculations to develop analytical measures.
- Present business insights through clear and effective reporting.
Program Outline
1. Introduction to Power BI
- Business intelligence concepts.
- Power BI Desktop and Service overview.
- Understanding the Power BI workflow.
2. Data Preparation and Transformation
- Connecting to data sources.
- Cleaning and transforming data using Power Query.
- Managing data quality and consistency.
3. Data Modeling
- Creating relationships between tables.
- Data modeling fundamentals.
- Introduction to DAX calculations.
4. Data Visualization and Dashboard Development
- Creating charts, tables, and KPIs.
- Building interactive reports.
- Applying filters, slicers, and drill-down features.
5. Reporting and Business Insights
- Report design and storytelling with data.
- Publishing and sharing reports.
- Using dashboards to support business decisions.
Who Should Attend?
- Business analysts and data analysts.
- Finance and accounting professionals.
- HR and operations professionals.
- Project managers and team leaders.
- Business intelligence professionals.
- Anyone seeking to improve data reporting and visualization skills.
Turn Data into Actionable Business Insights
Develop practical Power BI skills to transform data into meaningful reports, monitor performance, and support more informed business decisions.
Contact GBNTC to explore the program and strengthen your team’s data analytics capabilities.